Left Menu
27th Information for Share Holders
Shareholders / Investors service :
GRUH has its in-house secretarial department under the overall supervision of Mr. Marcus Lobo – Company Secretary / Compliance Officer. For any assistance regarding share transfers, transmissions, change of address, non receipt of dividend, duplicate /missing share certificates and other matters pertaining to your shares, please write to the following
address:
| Secretarial Department | Registrar & Transfer Agent |
|---|---|
| GRUH Finance Ltd. “GRUH” Netaji Marg, Nr. Mithakhali Six Roads, Ellisbridge, Ahmedabad 380 006 Tel : 079–32901222- 1223; |
MCS Limited Unit : “GRUH” 101, Shatdal Complex, 1st Floor, Opp. Bata Show Room, Ashram Road, Ahmedabad- 380 009 Tel : 079–26582878-80, 26584027 |
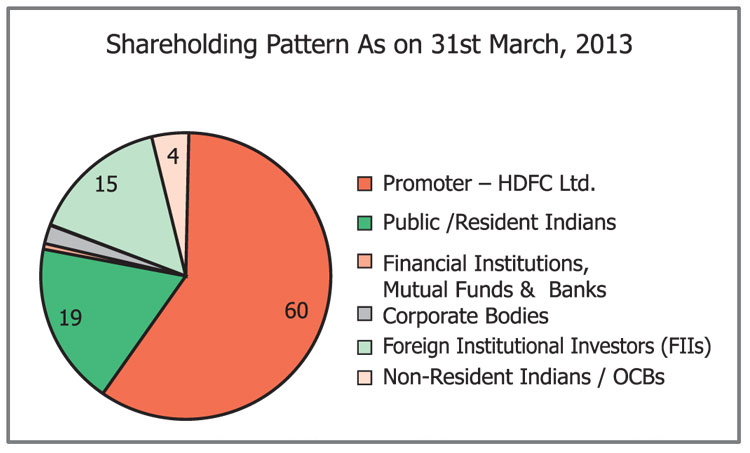
Shareholding Pattern as at March 31, 2013
| Category | No. of Share holders | Total No. of Shares Held | % to Capital |
|---|---|---|---|
| Promoter – HDFC Ltd. | 1 | 106538925 | 59.69 |
| Public /Resident Indians | 17775 | 33016742 | 18.51 |
| Financial Institutions, Mutual Funds & Banks |
12 | 692382 | 0.39 |
| Corporate Bodies | 510 | 3948571 | 2.21 |
| Foreign Institutional Investors (FIIs) | 74 | 27366426 | 15.33 |
| Non-Resident Indians / OCBs | 722 | 6913629 | 3.87 |
| Total | 19094 | 178476675 | 100.00 |
Top ten shareholders of GRUH as at March 31, 2013
| Name | No of shares | % of Capital |
|---|---|---|
| Housing Development Finance Corporation Limited | 106538925 | 59.69 |
| Smallcap World Fund, INC | 5450000 | 3.05 |
| Wasatch Emerging Markets Small Cap Fund | 3789600 | 2.12 |
| Dr. Sanjeev Arora | 3387250 | 1.90 |
| Acacia Partners, LP | 1848000 | 1.04 |
| Wasatch International Growth Fund | 1383955 | 0.78 |
| Ward Ferry Management Limited A/c. WF India Reconnaissance Fund Limited | 1317000 | 0.74 |
| Platinum Jubilee Investments Ltd. | 1067720 | 0.60 |
| Rachna Amin | 942500 | 0.53 |
| Acacia Institutional Partners, LP | 880000 | 0.49 |
Listing of Equity Shares
GRUH’s shares are listed on the BSE Ltd. and National Stock Exchange of India Ltd.
The Stock Code Nos. are :BSE: 511288; NSE: GRUH
The Company has arranged for the payment of listing fees for the year 2013-2014 as per the listing agreement with the respective stock exchanges.
Listing of Debt Securities
GRUH’s NCDs (Series – SD-001 & SD-002 aggregating to 35 crore) are listed on the Wholesale Debt Market (WDM) segment of the National Stock Exchange of India Limited (NSE).
Debenture Trustees
IDBI Trusteeship Services Limited, Asian Building, Ground Floor, 17, R. Kamani Marg, Ballard Estate, Mumbai – 400 021.
- Graph: Shareholding Pattern As on 31st March.2013
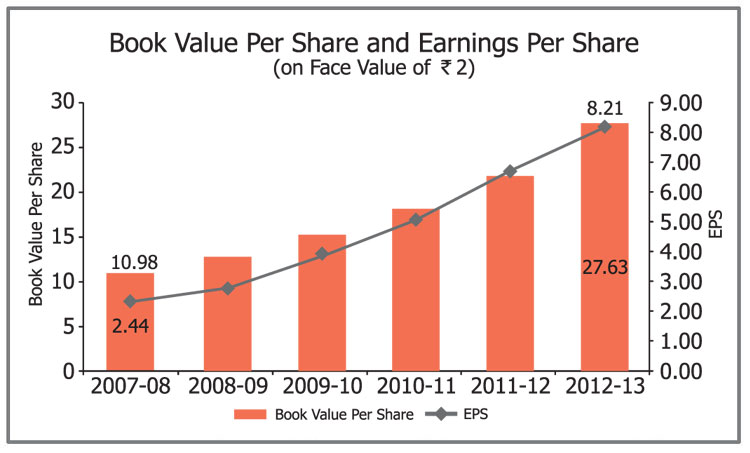
- Graph: Book Value Per Share and Earnings Per Share
Distribution of Shareholding As At March 31, 2013
| No. of Shares held | Folios | Shares | ||
|---|---|---|---|---|
| Numbers | % | Numbers | % | |
| Upto 500 | 11230 | 58.81 | 2302028 | 1.29 |
| 501 to 1000 | 2405 | 12.60 | 1927676 | 1.08 |
| 1001 to 5000 | 4483 | 23.48 | 9362919 | 5.25 |
| 5001 to 10000 | 458 | 2.40 | 3404012 | 1.91 |
| 10001 to 50000 | 373 | 1.95 | 7849235 | 4.40 |
| 50001 to 100000 | 56 | 0.29 | 4080741 | 2.28 |
| 100001 and above | 89 | 0.47 | 149550064 | 83.79 |
| Total | 19094 | 100.00 | 178476675 | 100.00 |
Dematerialisation of Shares
As at March 31, 2013, 97.92 % of equity shares of GRUH have been dematerialised by shareholders through National Securities Depository Limited and Central Depository Services (India) Limited .
ISIN for NSDL & CDSL : INE 580B01029
The status of shares which have been dematerialised and shares which are held in physical form as at March 31, 2013 are as under:
| Particulars | No of shares | (%) |
|---|---|---|
| Shares held in physical form | 3707600 | 2.08 |
| Shares held in electronic form | 174769075 | 97.92 |
| Total Shares | 178476675 | 100.00 |
Details regarding dividend paid during the last 7 years
| Year | Rate (%) | Book Closure Date | AGM Date | Payment Date |
|---|---|---|---|---|
| 2005-06 | 25 | May 12, 2006 to May 18, 2006 | July 7, 2006 | July 7, 2006 |
| 2006-07 | 30 | June 1, 2007 to June 7, 2007 | July 27, 2007 | July 27, 2007 |
| 2007-08 | 40 | July 15, 2008 to July 25, 2008 | July 25, 2008 | July 25, 2008 |
| 2008-09 | 48 | June 18, 2009 to June 30, 2009 | June 30, 2009 | June 30, 2009 |
| 2009-10 | 65 | June 17, 2010 to June 29, 2010 | June 29, 2010 | June 29, 2010 |
| 2010-11 | 110 | July 5, 2011 to July 14, 2011 | July 14, 2011 | July 18, 2011 |
| 2011-12 | 115 | June 8, 2012 to June 18, 2012 | June 18, 2012 | June 18, 2012 |
NB:Shareholders who have not received the dividends may kindly contact the secretarial department.
Unclaimed Dividend and Deposits
The Company has transferred all unclaimed/unpaid dividends up to the financial year 2004-2005 to the Investor Education and Protection Fund, as applicable. The Company has transferred matured deposits and interest thereon for the year 2004-2005 remaining unclaimed / unpaid, to the Investor Education and Protection Fund, in accordance with the current regulations.
Members who have either not received or have not encashed their dividend warrant(s) for the financial years 2005-2006 to 2011-2012 are requested to claim the unpaid dividend from the Company before transfer to the above mentioned fund. After transfer of unpaid/unclaimed dividend amount to the Investor Education and Protection Fund, the same cannot be claimed subsequently.
Dividends that have not been claimed by the shareholders for the financial year 2005-2006 will have to be transferred to the Investor Education and Protection Fund in August 2013 in accordance with the current regulations.
The details of the unclaimed dividend and the last date for claiming the same, prior to its transfer to the IEPF, are as under:
| Financial year | No. of Members who have not claimed their dividend | Unclaimed dividend as on March 31. 2013 ( ) | Unclaimed dividend as % to total dividend | Date of declaration | Last date for the claiming the dividend prior to its transfer to IEPF |
|---|---|---|---|---|---|
| 05-06 | 1,030 | 4,37,630 | 0.66 | July 7, 06 | Aug 4, 13 |
| 06-07 | 1,095 | 5,51,706 | 0.53 | July 27, 07 | Aug 24, 14 |
| 07-08 | 1,070 | 6,88,220 | 0.50 | July 25, 08 | Aug 23, 15 |
| 08-09 | 1,143 | 9,21,940 | 0.55 | June 30, 09 | July 28, 16 |
| 09-10 | 1,143 | 12,05,468 | 0.53 | June 29, 10 | July 27, 17 |
| 10-11 | 1,122 | 18,49,738 | 0.48 | July 14, 11 | Aug 11, 18 |
| 11-12 | 1,271 | 21,06,077 | 0.52 | June 18, 12 | July 17, 19 |
Nomination Facility
Where shares are held in single name, in case of an unfortunate death of the shareholder, the process of transmission is cumbersome as it requires submission of succession certificate / letter of probate / will, etc. Shareholders holding shares in single name and in physical form are requested to submit the prescribed form 2B (in duplicate) to the secretarial department to avail of the nomination facility. Shareholders may contact the secretarial department for the said form. Shareholders holding shares in demat form are requested to contact their depository participants for availing the nomination facility.
Service Standards
GRUH is committed to providing effective and prompt service to its investors. The Secretarial Department has been entrusted with the responsibility of ensuring that the investors of the Company are serviced in accordance with the service standards. Listed below are the service standards adopted by the Company in respect of various services being rendered by the Secretarial Department.
| Nature of Service* | Time Taken |
|---|---|
| Transfer of shares | 10 working days |
| Issue of duplicate/revalidation of dividend warrant(s) | 7 working days |
| Change of address/ECS/ Bank details | 7 working days |
| Registration of Nomination | 4 working days |
| Transmission of shares/ Deletion of name | 10 working days |
| Split/Consolidation of share certificate(s) | 10 working days |
* Subject to receipt and verification of valid documents and requisite approvals.
The investors are requested to contact the Secretarial Department for availing any of the said services. The Company has designated an exclusive e-mail address viz. [email protected], which would enable investors to post their grievance.
A status report on adherence to the said service standards is reviewed by the company secretary on a monthly basis and a detailed report is tabled at the meetings of the Investor Relations & Grievance Committee, for its review and noting.
Measuring Shareholders’ Value
At GRUH, we believe in maximizing the wealth of its shareholders and our endeavors are in the direction of providing maximum value to our shareholders either in the form of dividend or capital appreciation. The value of Shareholders’ return is measured as follows:
A. Total Shareholders’ Return
Total Shareholders’ return includes the dividend paid by the Company as well as the capital appreciation of the shares of the Company in the stock markets. During the past five years return to shareholders has been as follows :
( in crore)
| Particulars | 2012-13 | 2011-12 | 2010-11 | 2009-10 | 2008-09 |
|---|---|---|---|---|---|
| Closing Market Capitalisation | 3753.36 | 2248.60 | 1266.38 | 756.14 | 324.69 |
| Opening Market Capitalisation | 2248.60 | 1268.38 | 756.14 | 324.69 | 534.79 |
| Money raised during the year from Shareholders | 12.30 | 2.39 | 7.12 | 1.17 | 0.03 |
| Net Capital Appreciation / (Depreciation) | 1492.46 | 977.83 | 503.12 | 430.28 | (210.13) |
| Dividend including dividend tax | 52.46 | 47.29 | 45.04 | 26.32 | 19.46 |
| Total Gain / Loss | 1544.92 | 1025.12 | 548.16 | 456.60 | (190.67) |
| Gain / (Loss) to Opening Market Capitalisation (%) | 68.71 | 80.82 | 72.50 | 140.63 | (35.65) |
B. Enterprise Value
Enterprise Value (EV) measures the value of a Company as on a particular date. It is calculated by making adjustments to the market capitalisation of a Company. The formula for measuring Enterprise Value is :
Enterprise Value (EV) = Market Capitalisation + Total Debt – Cash Balance
With the Enterprise Value as a measure, the companies can be compared easily irrespective of their capital structure. Moreover, Enterprise value is used to calculate the ratio of EV to EBIDTA multiple.
EBIDTA stands for Earnings before Interest, Depreciation, Tax and other appropriations. Hence, it can be calculated by adding back the figures of interest, depreciation and other appropriations to the amount of Profit Before Tax (PBT). It indicates that the value of enterprise is equal to number of times of the Company’s earnings. As the figures of Interest, depreciation and tax are added back, it makes the comparison between two enterprises easier by eliminating all the accounting and tax differences.
The above measure for GRUH for a period of five years is as follows : –
| Particulars As at March 31, | 2013 | 2012 | 2011 | 2010 | 2009 |
|---|---|---|---|---|---|
| Number of Equity Shares of 2 each (Previous years 10 each) (Crores) | 17.85 | 3.53 | 3.52 | 3.47 | 3.47 |
| Market Price () of face value of 2 each previous year 10 each* | 210.30 | 636.95 | 360.20 | 217.75 | 93.70 |
| Market Capitalisation | 3753.36 | 2248.60 | 1266.38 | 756.14 | 324.69 |
| Total Debt | 4914.52 | 3833.00 | 2966.33 | 2323.12 | 2245.15 |
| Cash | 13.12 | 114.98 | 93.69 | 135.60 | 71.24 |
| Enterprise Value (EV) | 8654.76 | 5966.62 | 4139.02 | 2943.66 | 2498.60 |
| EBIDTA | 603.20 | 475.23 | 328.32 | 276.06 | 271.72 |
| EV/ EBIDTA (Times) | 14.35 | 12.56 | 12.61 | 10.66 | 9.20 |
| TOTAL INCOME | 650.45 | 514.24 | 361.27 | 309.06 | 295.28 |
| EV/TOTAL INCOME (Times) | 13.31 | 11.60 | 11.46 | 9.52 | 8.46 |
*Considered as the price on the stock exchange where maximum number of shares have been traded.
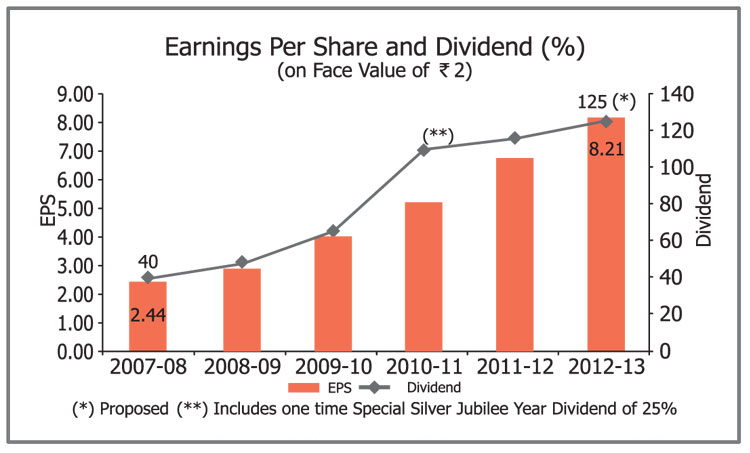
- Graph: Earnings Per Share and Dividend (%)
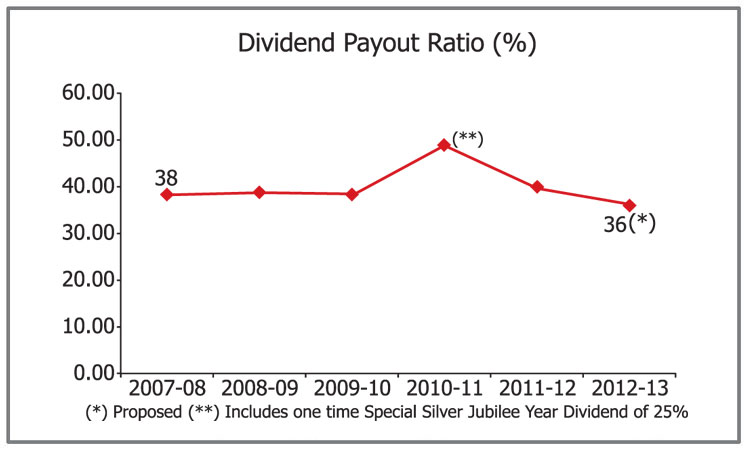
- Graph: Dividend Payout Ratio (%)
Stock Market Data
Monthly high and low quotations as well as the volume of shares traded at the BSE Ltd. and the NSE for 2012-2013 along with the BSE Sensex and NIFTY are as follows:
BSE 2012-2013:
| Month | Highest () | Lowest () | Volume of Shares traded | BSE Sensex |
|---|---|---|---|---|
| April 2012* | 150.38 | 126.00 | 913415 | 17139 |
| May 2012* | 141.00 | 127.60 | 200155 | 16219 |
| June 2012* | 145.00 | 133.33 | 790040 | 17430 |
| July 2012* | 170.00 | 145.30 | 1828003 | 17236 |
| August 2012 | 193.25 | 153.00 | 763776 | 17430 |
| September 2012 | 210.00 | 175.20 | 672258 | 18763 |
| October 2012 | 223.95 | 178.70 | 1143398 | 18508 |
| November 2012 | 219.90 | 187.90 | 1136803 | 19340 |
| December 2012 | 245.00 | 200.00 | 2036927 | 19427 |
| January 2013 | 249.70 | 216.55 | 1241044 | 19895 |
| February 2013 | 230.85 | 207.50 | 277860 | 18862 |
| March 2013 | 220.00 | 194..35 | 412592 | 18836 |
NSE 2012-2013:
| Month | Highest () | Lowest () | Volume of Shares traded | NSE (Sensex monthly close) |
|---|---|---|---|---|
| April 2012* | 150.45 | 126.88 | 2215955 | 5248 |
| May 2012* | 140.40 | 127.20 | 745145 | 4924 |
| June 2012* | 166.00 | 132.40 | 2129605 | 5279 |
| July 2012* | 163.77 | 145.95 | 2079065 | 5229 |
| August 2012 | 193.35 | 151.55 | 2021258 | 5286 |
| September 2012 | 210.00 | 174.50 | 1692740 | 5703 |
| October 2012 | 224.90 | 179.00 | 2934087 | 5620 |
| November 2012 | 216.60 | 187.45 | 3155392 | 5880 |
| December 2012 | 245.40 | 171.50 | 2159442 | 5905 |
| January 2013 | 250.00 | 216.20 | 2223266 | 6035 |
| February 2013 | 230.65 | 208.00 | 795220 | 5693 |
| March 2013 | 219.00 | 195.00 | 1986452 | 5682 |
* The nominal face value of the equity shares of the Company was sub-divided from 10 per equity share to 2 per equity share, with effect from July 26, 2012. The ex-date for sub-division of the equity shares was July 25, 2012. The share price and number of shares traded have been adjusted in the ratio of sub-division to make the same comparable.
- Graph: Net Worth and Return on Net Worth (%)

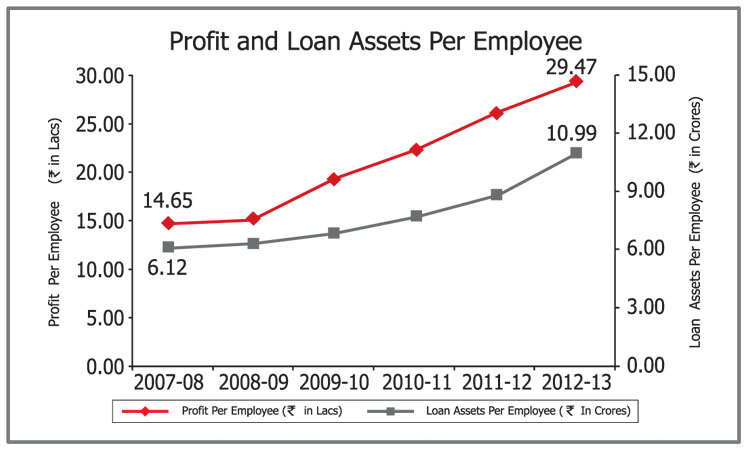
- Graph: Profit and Loan Assets Per Employee
